Since the supreme court legalized interracial marriages in
the case of Loving v. Virginia in 1967,
the multiracial population has steadily increased and is now considered the
largest growing demographic in America. But more often than not, mixed
experiences go unseen or misrepresented.
Visualizing the need for multiracial representation in media & its impact on self-identity, To See/Be Seen is an explorative visual database that centers multiracial experiences in the media over the last 30 years. It gives a home to marginalized narratives through abstract data-driven 3D forms.
Visualizing the need for multiracial representation in media & its impact on self-identity, To See/Be Seen is an explorative visual database that centers multiracial experiences in the media over the last 30 years. It gives a home to marginalized narratives through abstract data-driven 3D forms.
Tools
Sketching
Excel
Observable
Three.js
Sketching
Excel
Observable
Three.js

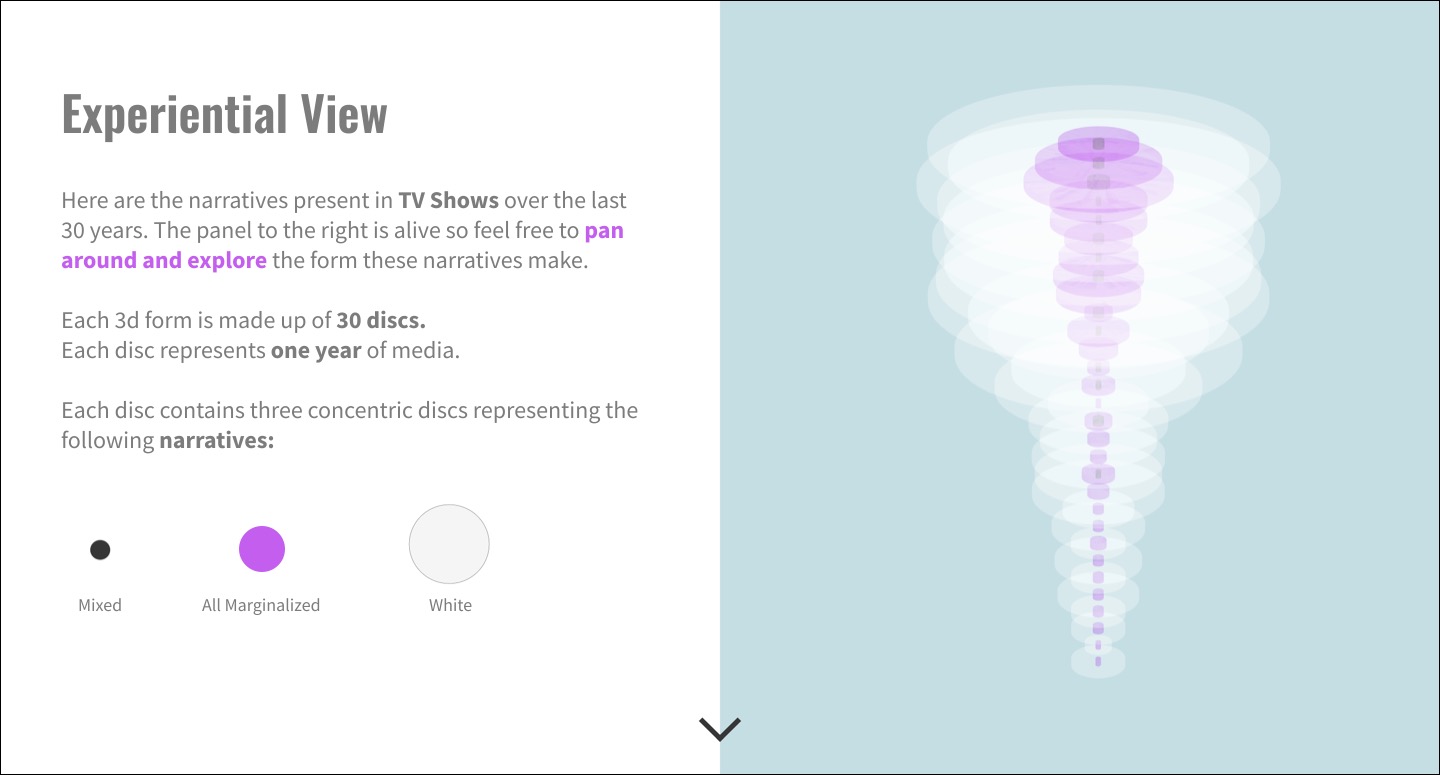
Each
form is encoded with data of a single media type from IMDb and
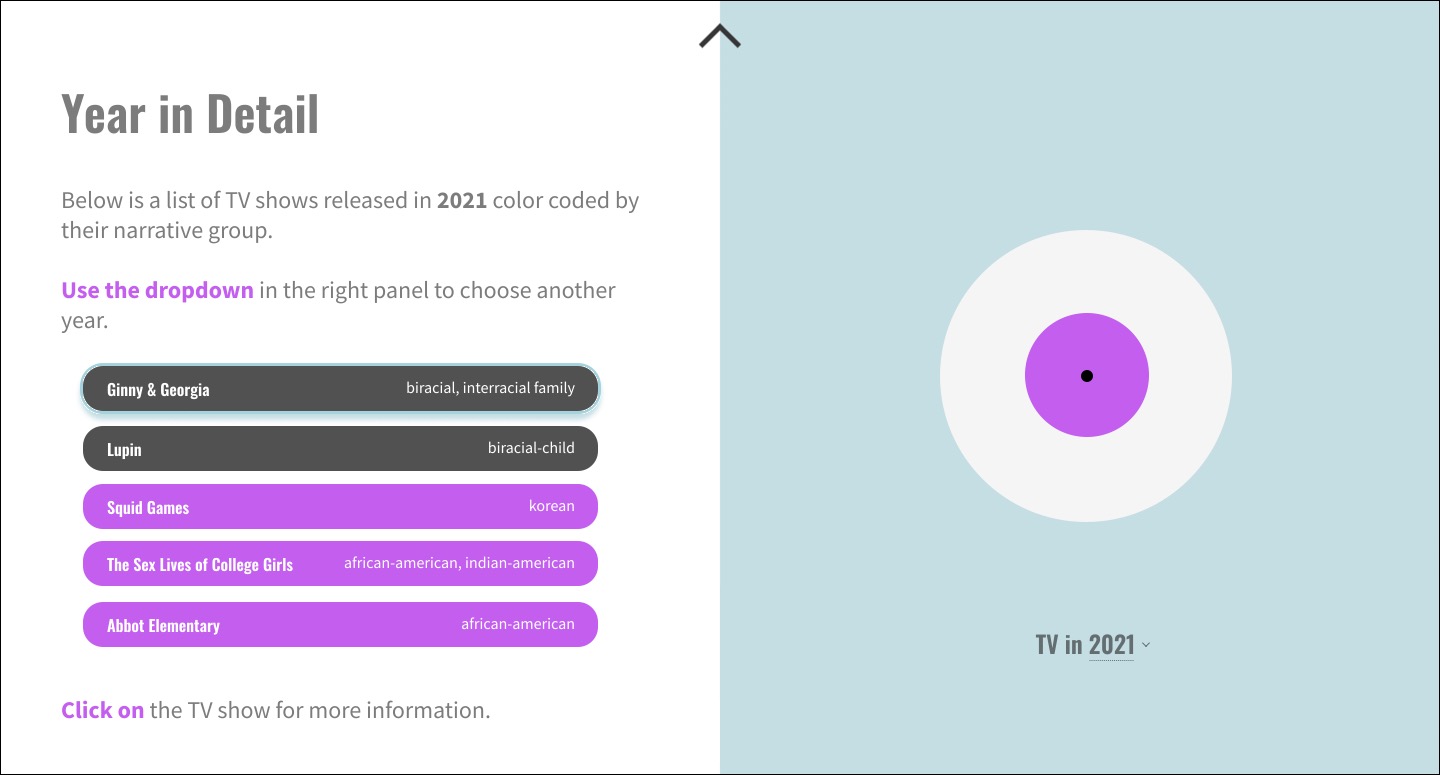
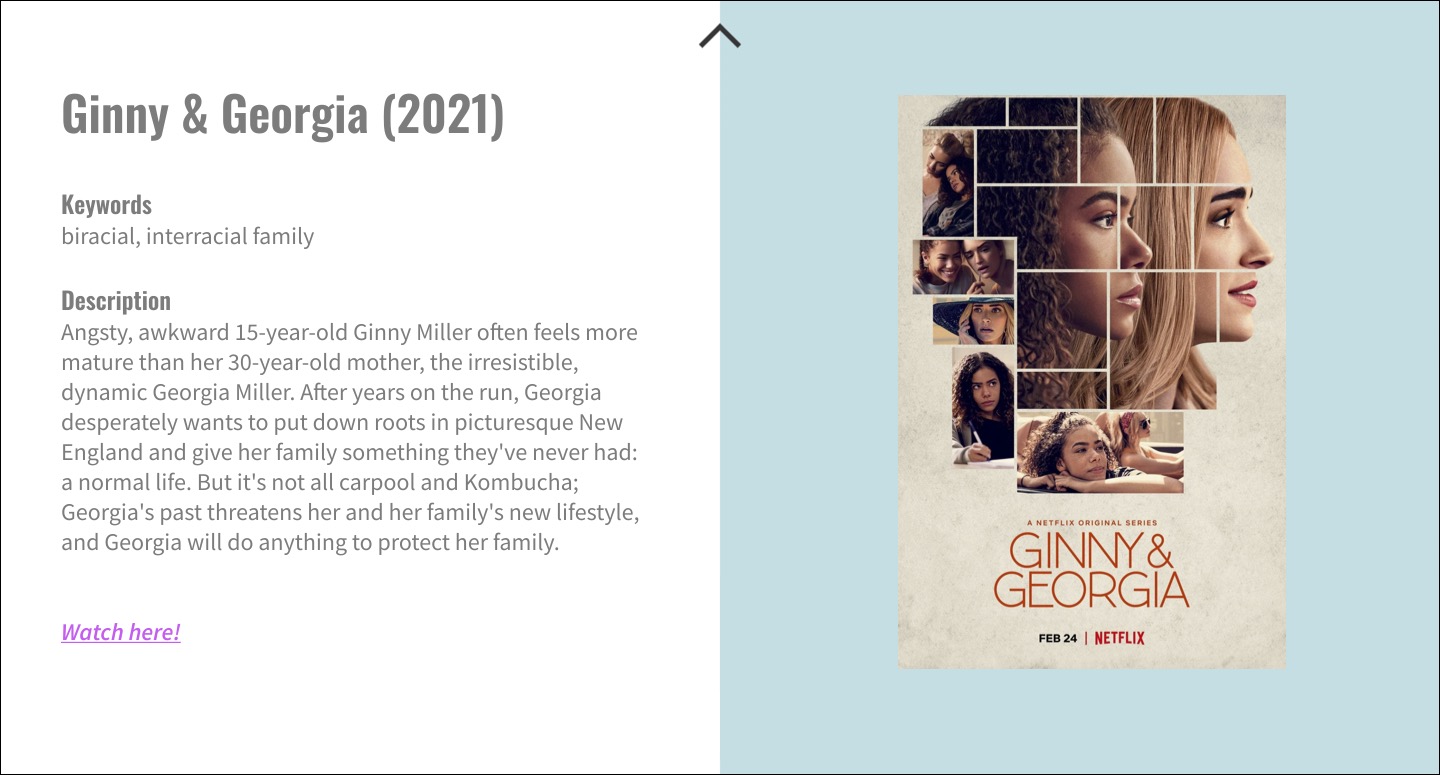
sorted by keyword descriptors, above is TV shows.
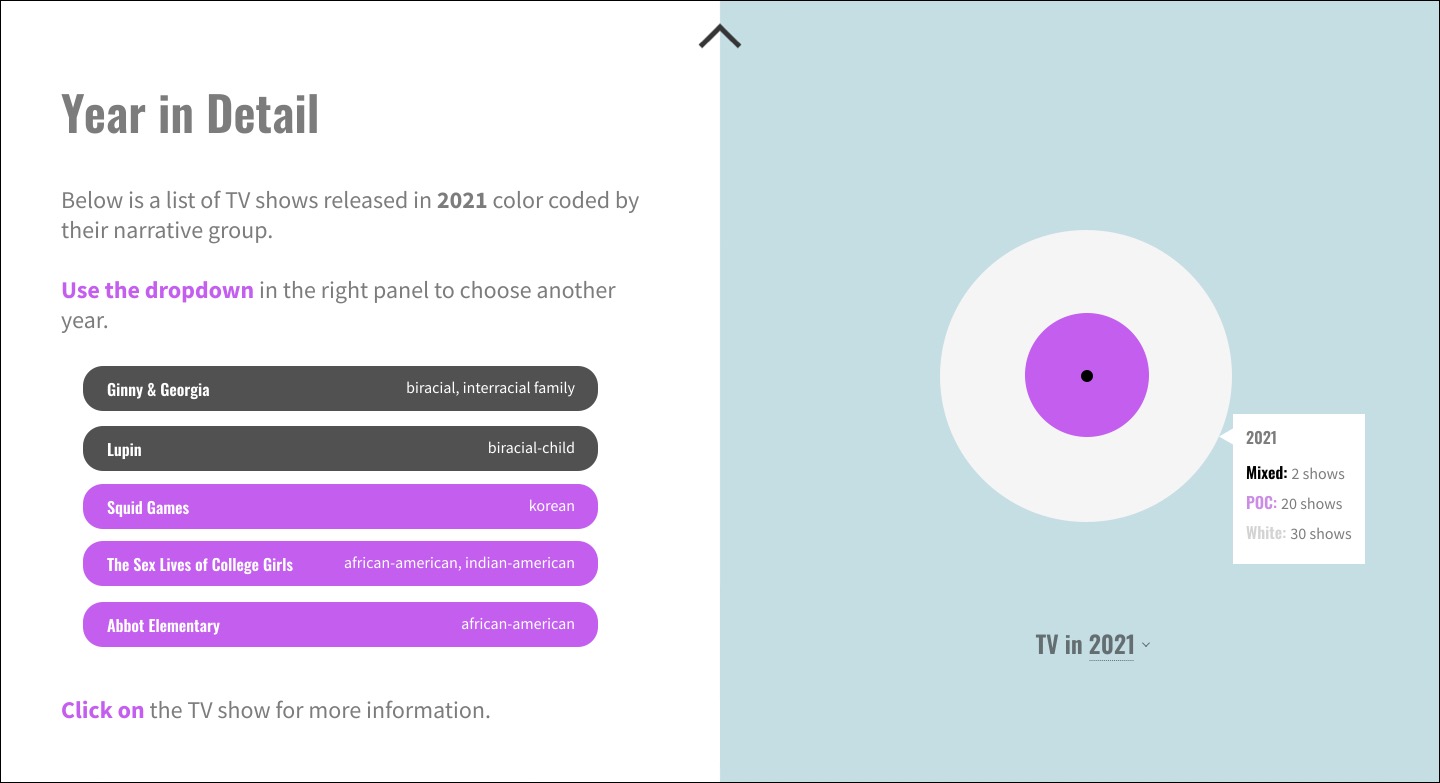
Through exploration, one can uncover stories where they can
see themselves and be seen by others who’ve come to learn more about
experiences beyond their own.
The black represents
stories about multiracial experiences. The pink about all marginalized groups.
And lastly, the form’s misty transparent white represents stories about the
dominant culture - this layer can be interpreted as the foggy effect of
assimilation. This cloud of white culture surrounds marginalized people in
their everyday lives.


A keynote presentation that explores the project more in depth was delivered last May.
Watch Video Presentation ︎︎︎
Watch Video Presentation ︎︎︎
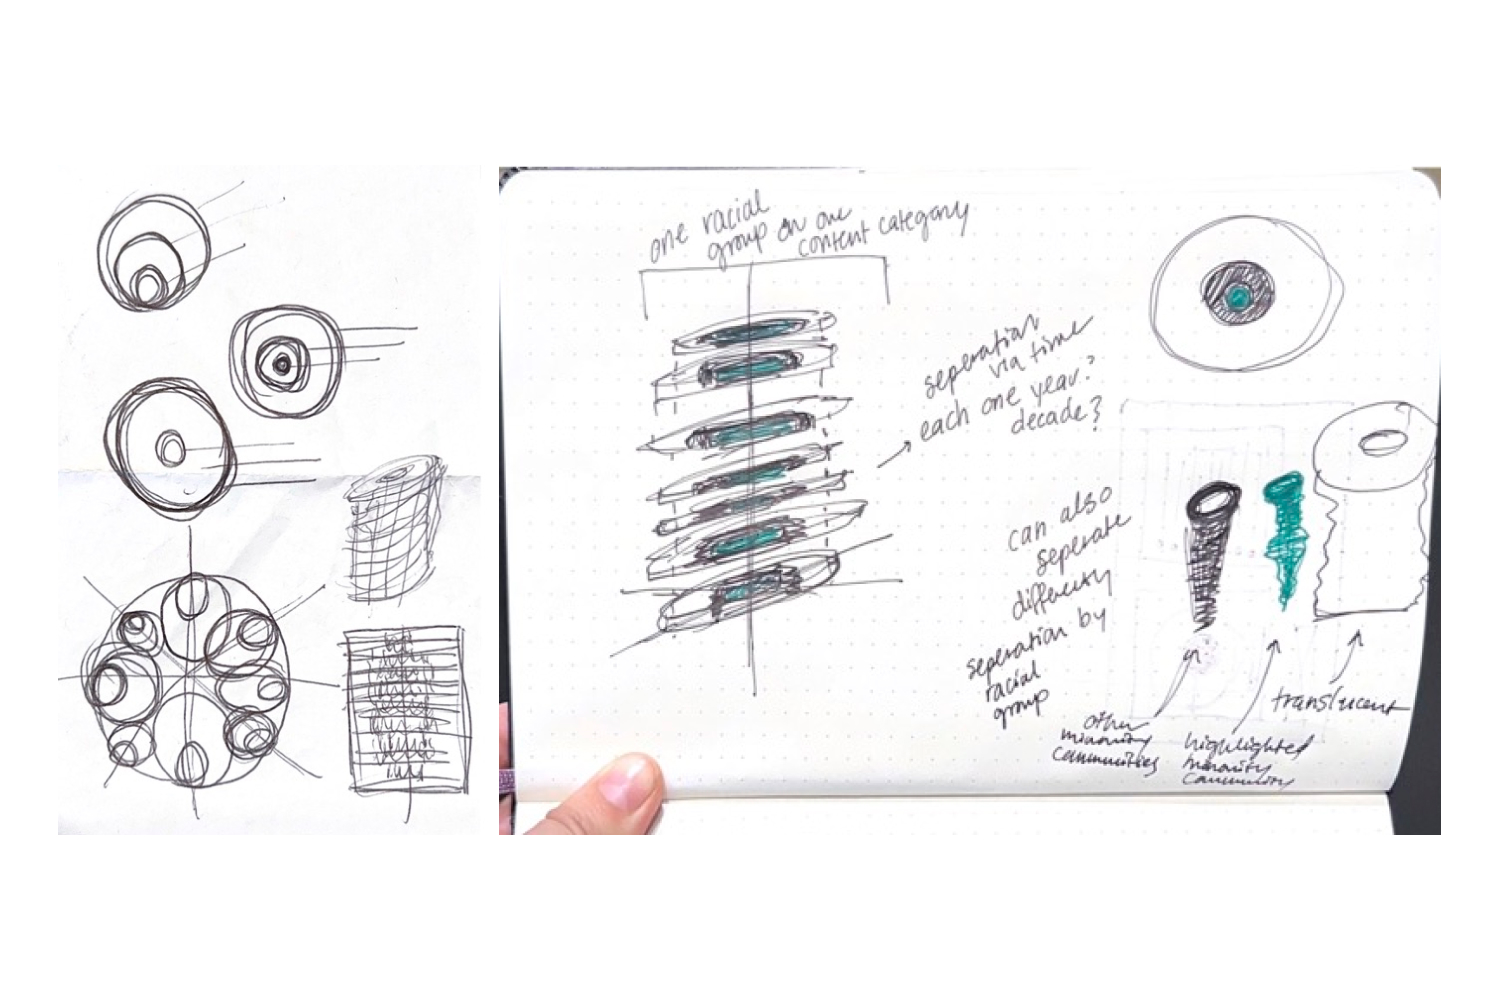
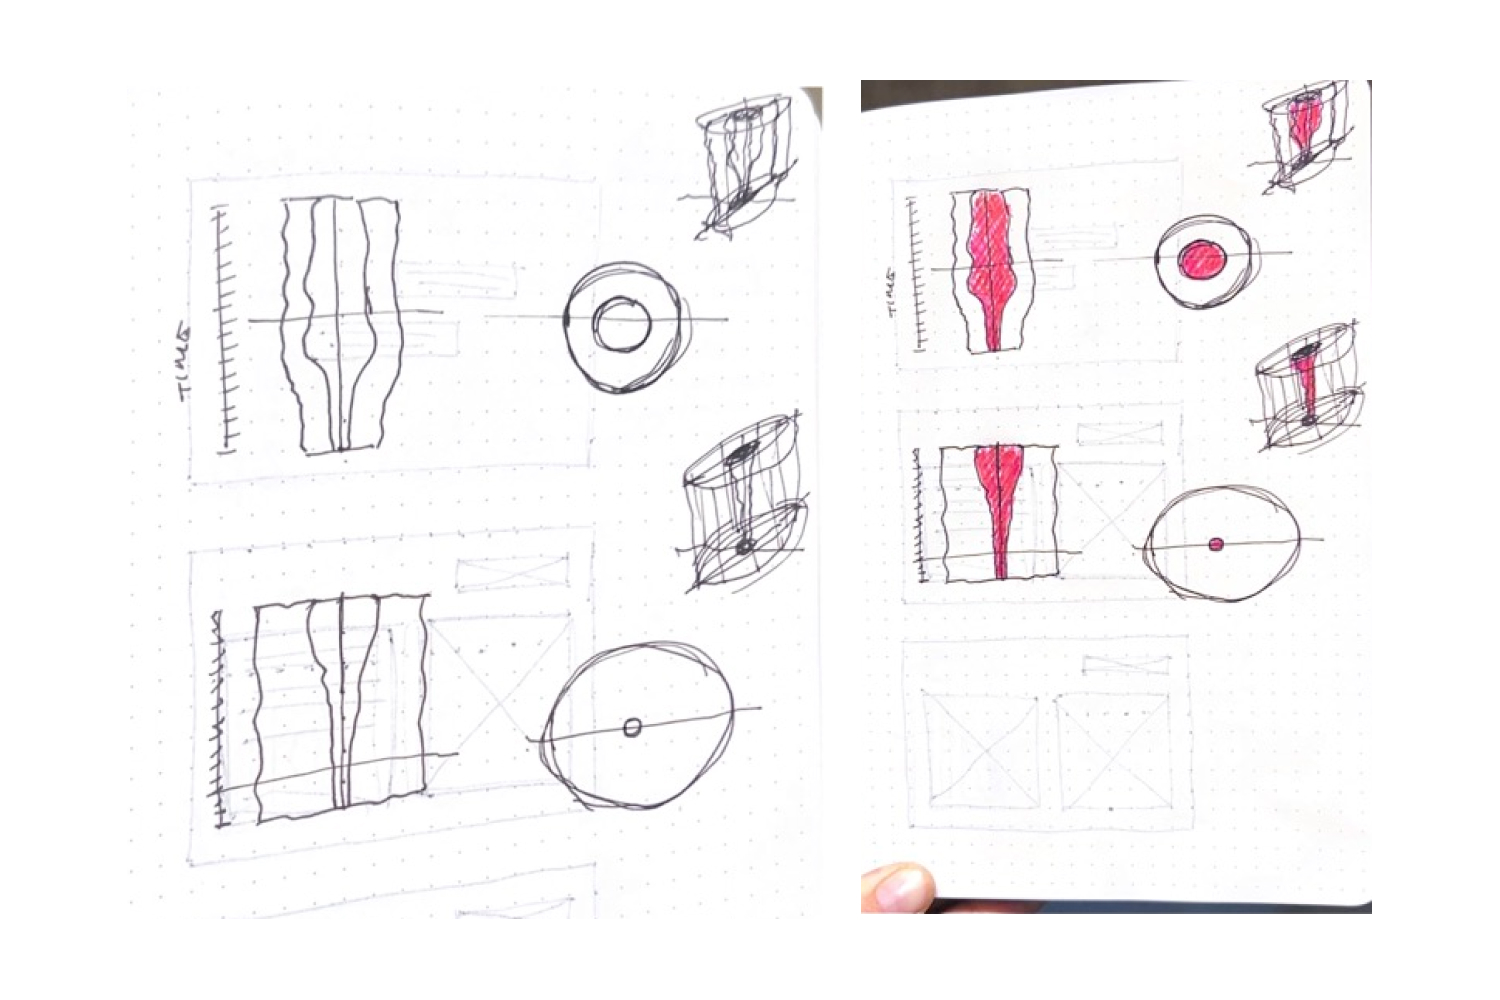

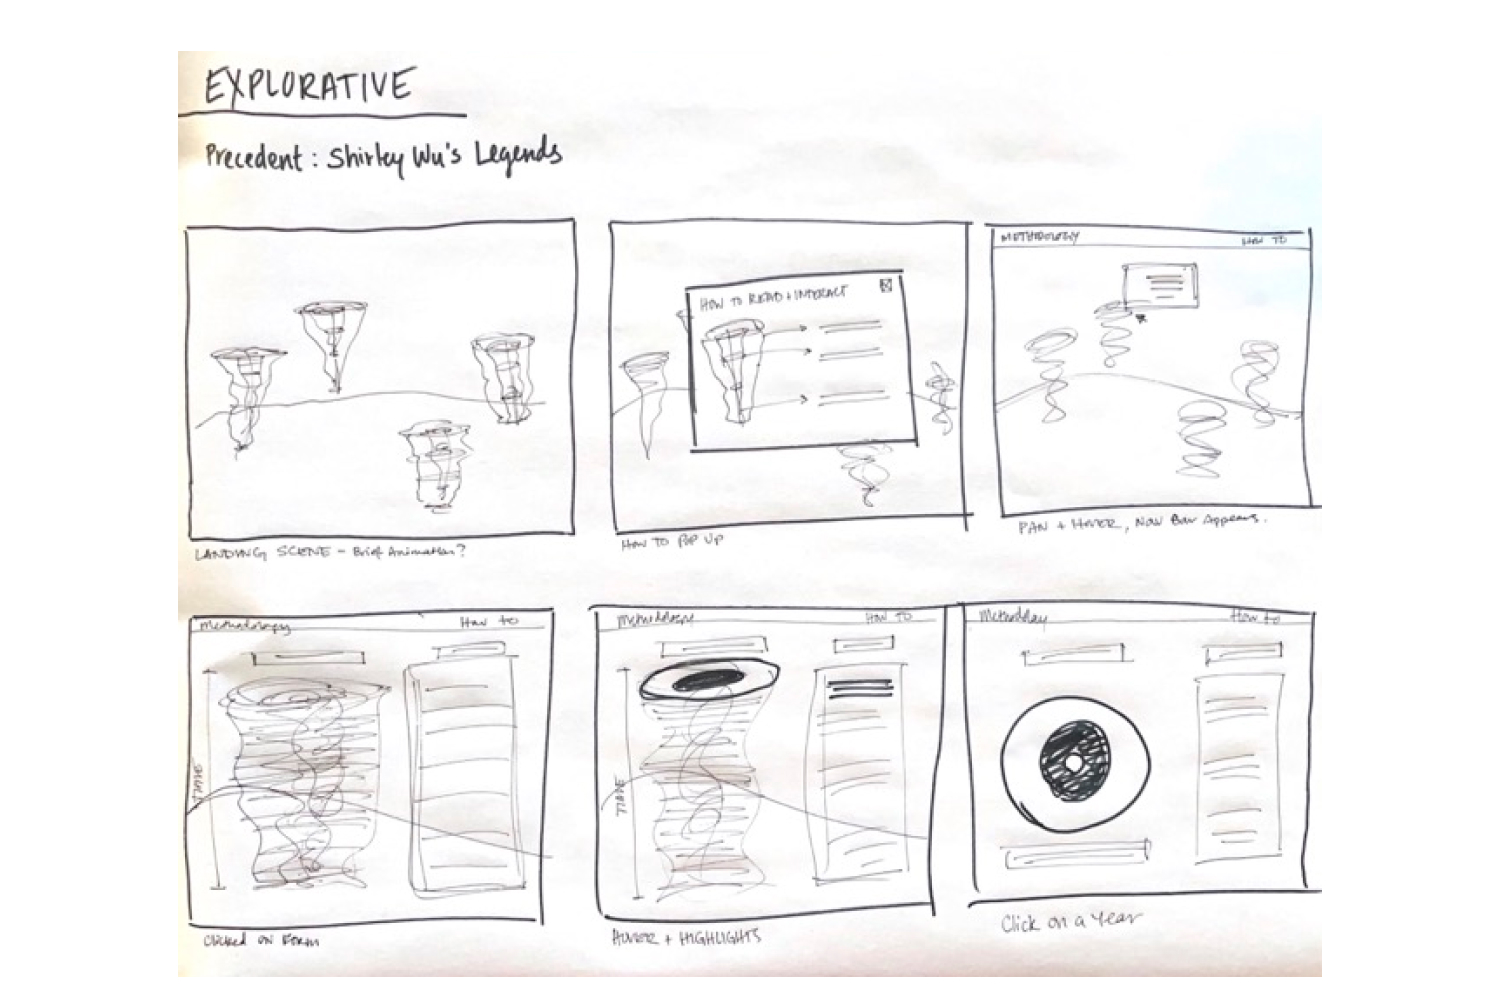
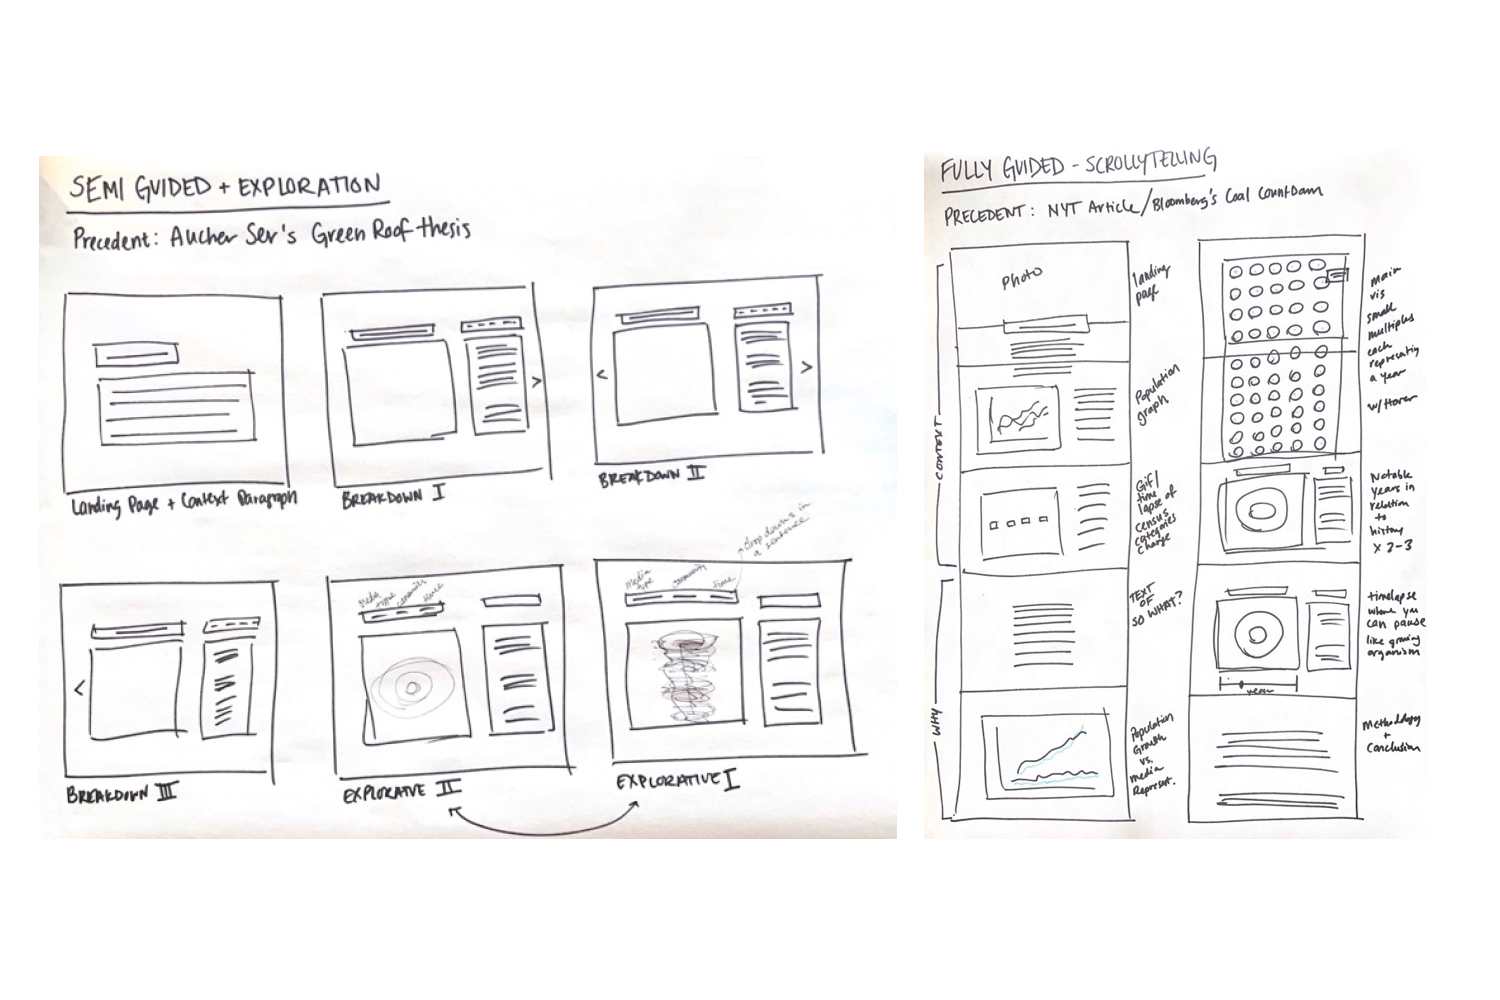
Iterative sketching served to work through the 3D to 2D visualization concept. Three user experiences concepts were investigated: Semi-Guided (1), Fully Guided (2),and Explorative (3).
After prototyping and working with the data, the Explorative(3) experience was chosen as the best path forward for the project.
